
Energy is key to keep the global economy churning. Today, we use mostly 3 kinds of natural resources to power our world. 90% of our energy comes almost equally from Coal, Natural Gas, and Oil. And then we have some other cleaner forms of energy like Wind, Nuclear, Hydro and Solar.

Solar has been making in-roads into the energy mix steadily for the past decades. But only nowadays it feels like solar is becoming mainstream. In fact, little known fact, installed solar power has been increasing at the rate of double every two years for the past 25 years.

And that exponential growth is not slowing but accelerating. And one might wonder – why is that happening? While the efficiency of a solar panel only increased marginally over the past 30 yrs, the cost of a solar panel has been decreasing steadily during the same period.
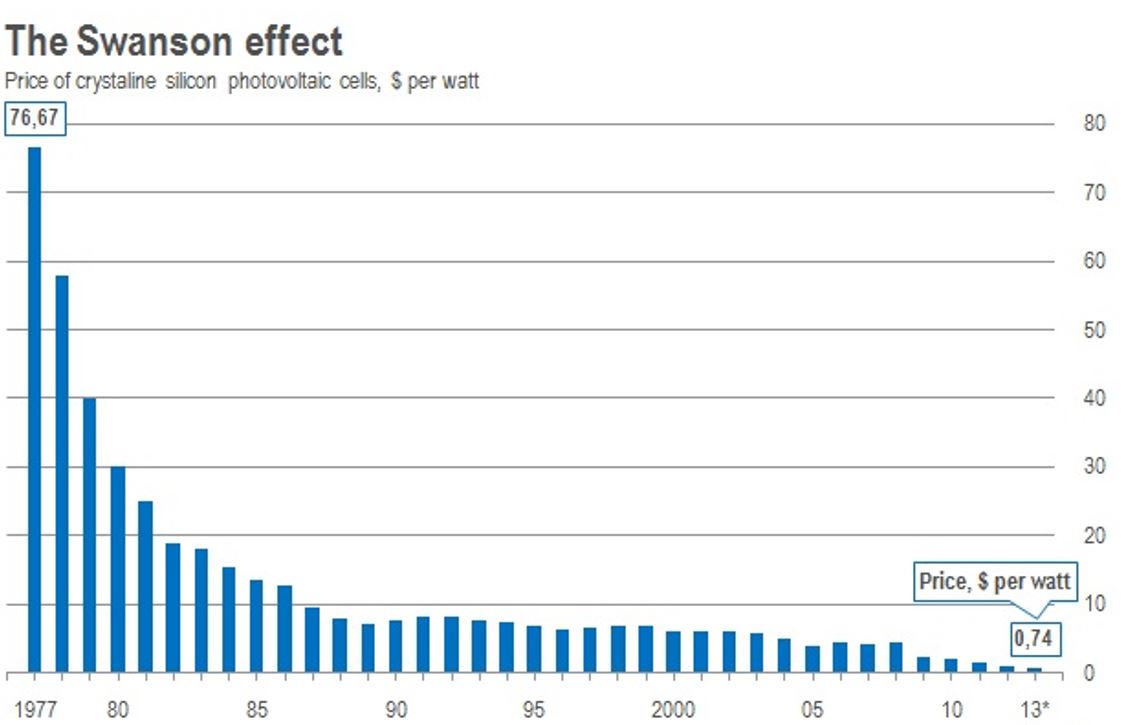
Actually by a factor 100. From about $70 per Watt in 1970s to about $0.70 per Watt today. Furthermore, the cost of an installed system continues to decrease by about 7% each year.
It is for that reason that installed solar energy has been growing exponentially over the past decades. Today in Q4 2015, we are reaching 1,000,000 solar installations in the US.

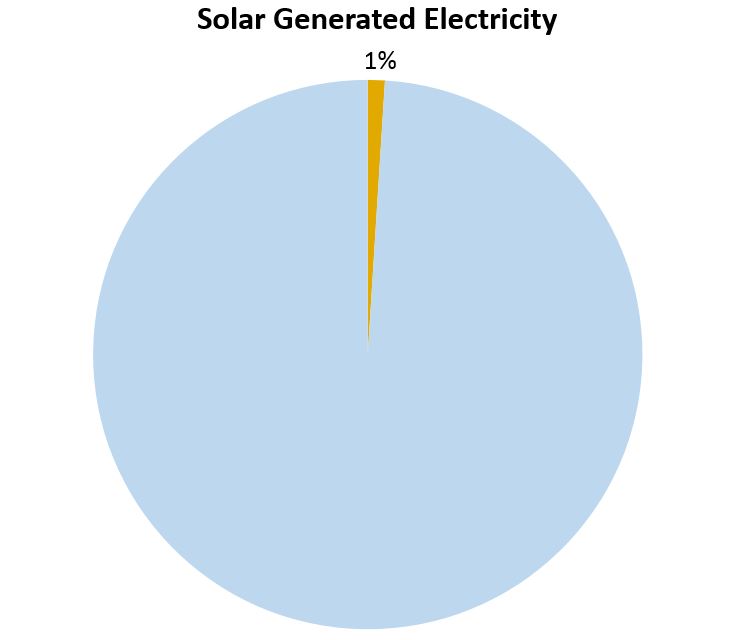
And, today in Q4 2015, we are generating 1% of our electricity with solar energy.
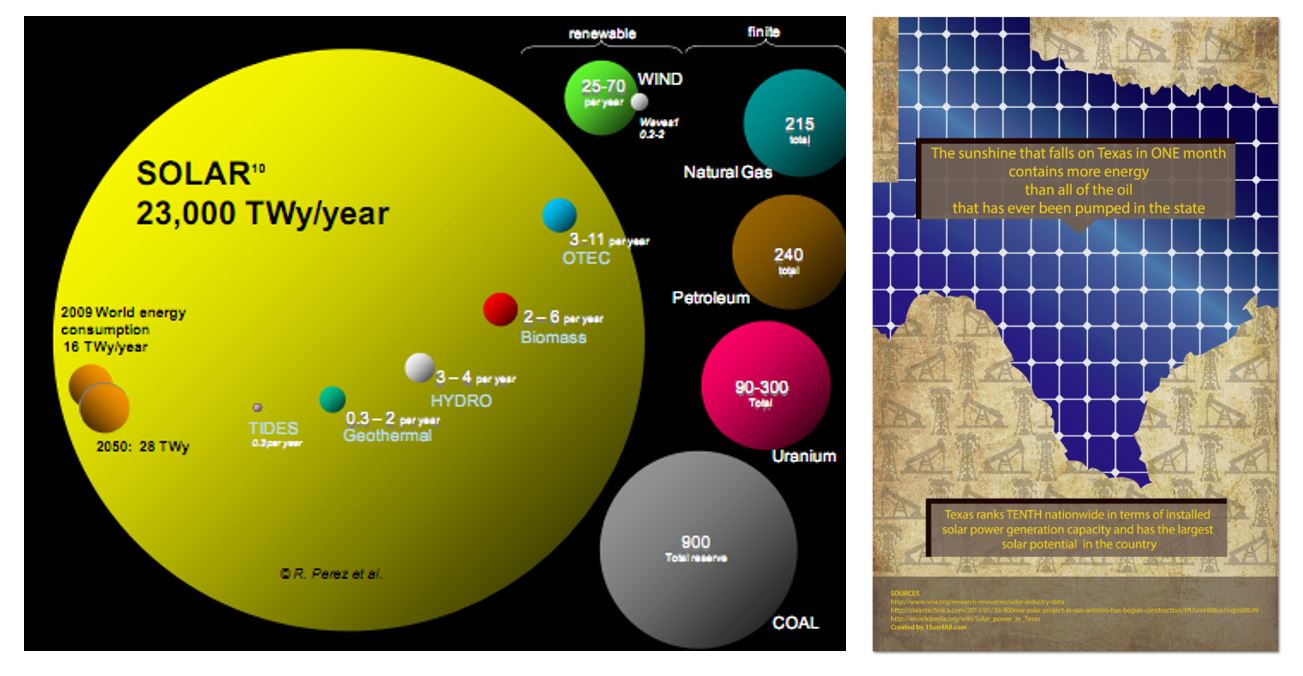
And, solar’s potential is enormous compared to all other forms of energy. Solar energy is so abundant, it is hard to explain! Even if we were generating all of the world’s energy needs with solar energy today (and by the way, we are on track to reach that scale in just about 14 years), we would only be using 1 in 10,000 part of all the solar energy that shines onto the world. In fact, here is an amazing fact: The amount of sunshine that falls on Texas in ONE month contains more energy than all of the oil that has ever been pumped in the state.
It is for these reasons that solar energy is growing at 30-40% per year across the globe for the last 25 years. And that growth is accelerating these days. Solar is becoming a key part of our energy economy. And it is for these reasons that most experts agree that solar will generate a huge portion of our energy in the future.
So then the question is: How can you benefit from this amazing trend? Should you go solar? If so, how?
Here is the quick answer:
IF
- you live in an average sunny location
- and have the roof space or land (ideally with a slight south tilt)
- and you are paying more than 13 cents / kWh
THEN >> YES, GO SOLAR.
ELSE >>
- Look into investing in community solar projects
- Or solar financing platform to make a 4-20+% return on your investment
If you want the detailed answer, then you need to get a bit deeper into the Solar Math. So keep reading.
Let’s look into the details of Solar Math and see why nowadays Solar economics make so much sense.
Before we delve into the financials there is one high school physics topic we need to brush up on. And that is the relationship between Power and Energy.
Energy is defined as “the ability to do work.” Power is how fast (or slow) the work is done. It may take the same amount of energy to walk or run up a steep hill, but it takes more power to run than to walk.
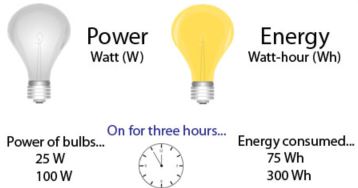
Here is another way to think about Power & Energy… Think of a light bulb rated at 100 Watts. This is the power rating for the bulb. It tells us how much electricity the bulb can transform into light and heat over a given amount of time. If left on for one hour, a 25-W bulb will use 25 Watt-hours (Wh) of energy.
In the same amount of time, a 100 W bulb will use four times as much energy as a 25 W bulb. If you leave them both on for one hour, the 25-W bulb uses 25 Watt-hours (Wh) of energy and the 100-W uses 100 Watt-hours of energy. After 3 hours, it’s 75 Wh and 300 Wh respectively.
The power company charges you based not on how many light bulbs you have, but for how much energy they use while you have them turned on. The same is true for all electrical loads. You are charged for the energy they use (power x time), usually measured in kilowatt-hours (kWh).
Now that we have Power (Watt) and Energy (Watt hour) behind us, let’s look at how a solar PV works.
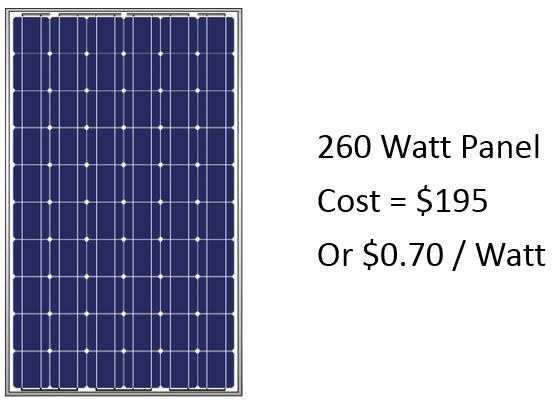
This is a typical solar panel. It is a 260 Watt panel. It cost about $0.70 per Watt. In other words, about $200 or $195 to be exact. There are dozens of reputable solar panel manufacturers that produce similar panels.
When the sun shines on this panel, in an average sunny location in the US, each Watt of panel will produce energy for about 4-6 hours of the day (between ~9Am to ~3PM) depending on the season of the year and the solar resource of the location.
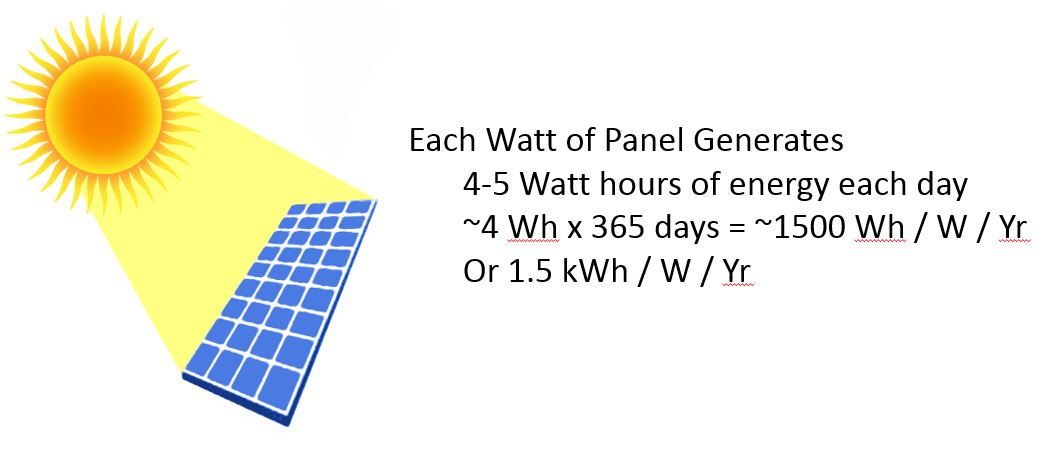
So if we assume the lower end of the figures, each Watt of panel will generate about 4 Watt hours of energy each day. So over a year, each Watt will generate about (4 Wh x 365 days) ~1500 Watt hours of energy. Or 1.5 kWh per Watt per Year.
Keep in mind, depending on where you are in the US (or the world) your kWh production per Watt will differ slightly. For example, if you are in overcast and rainy Seattle, you should expect a slightly lower production (around 1200-1300 Wh per W) versus sunny San Diego (around 1650-1800 Wh per W).
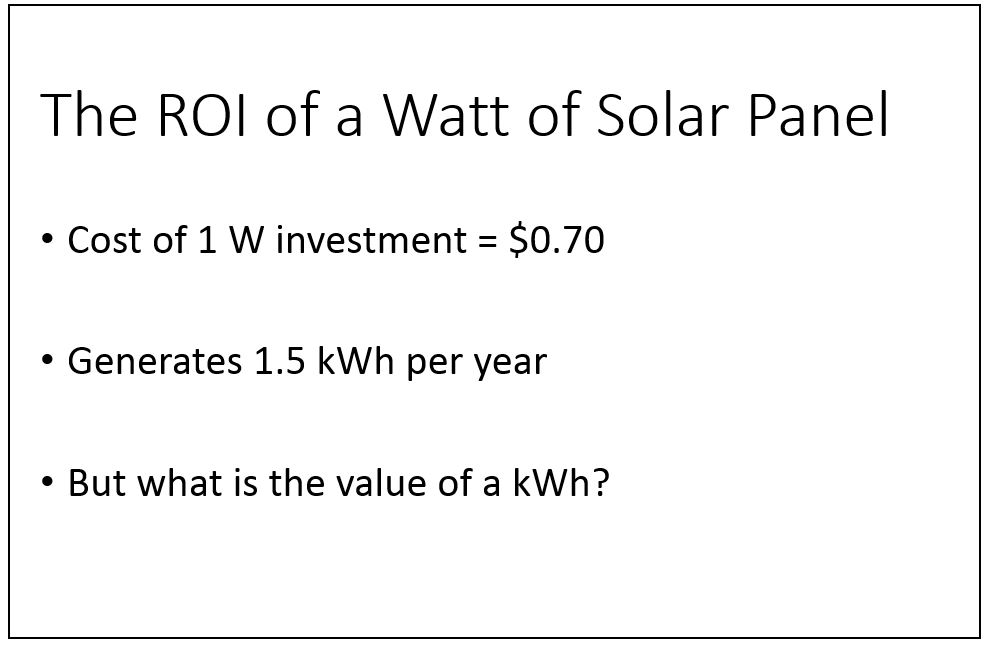
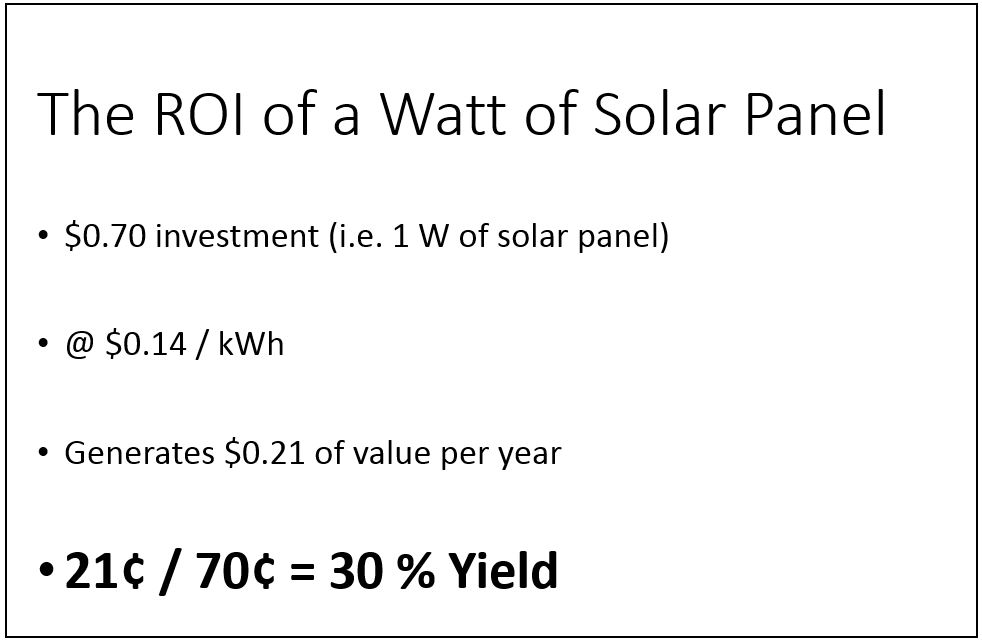
So, we know that nowadays a Watt of solar panel costs 70 cents. And it generates on average 1500 Wh (1.5kW) of energy per year. And what is the value of that?
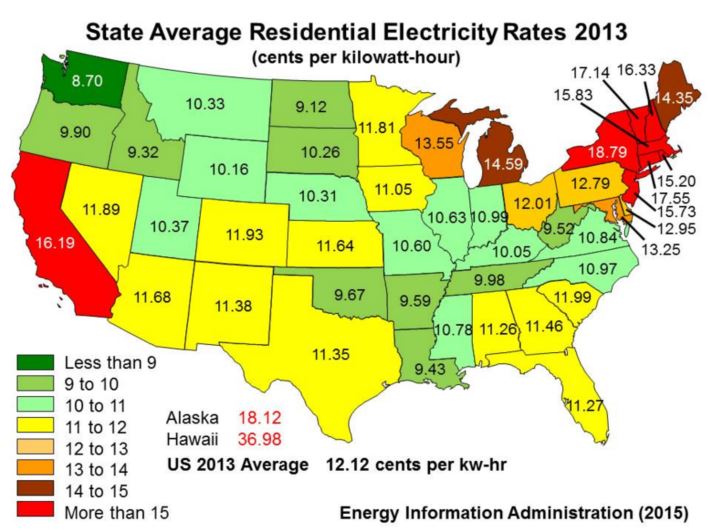
Well, the value of a kWh ranges widely depending on where you are and what you pay for electricity. Considering that there are over 2,000 Utility companies in the US, it is not a straight forward answer. Below is a map of the US with the average cost of retail electricity in each State. Please note that what you are paying might be quite different than the average price depending on your utility company and the rate structure you are on.
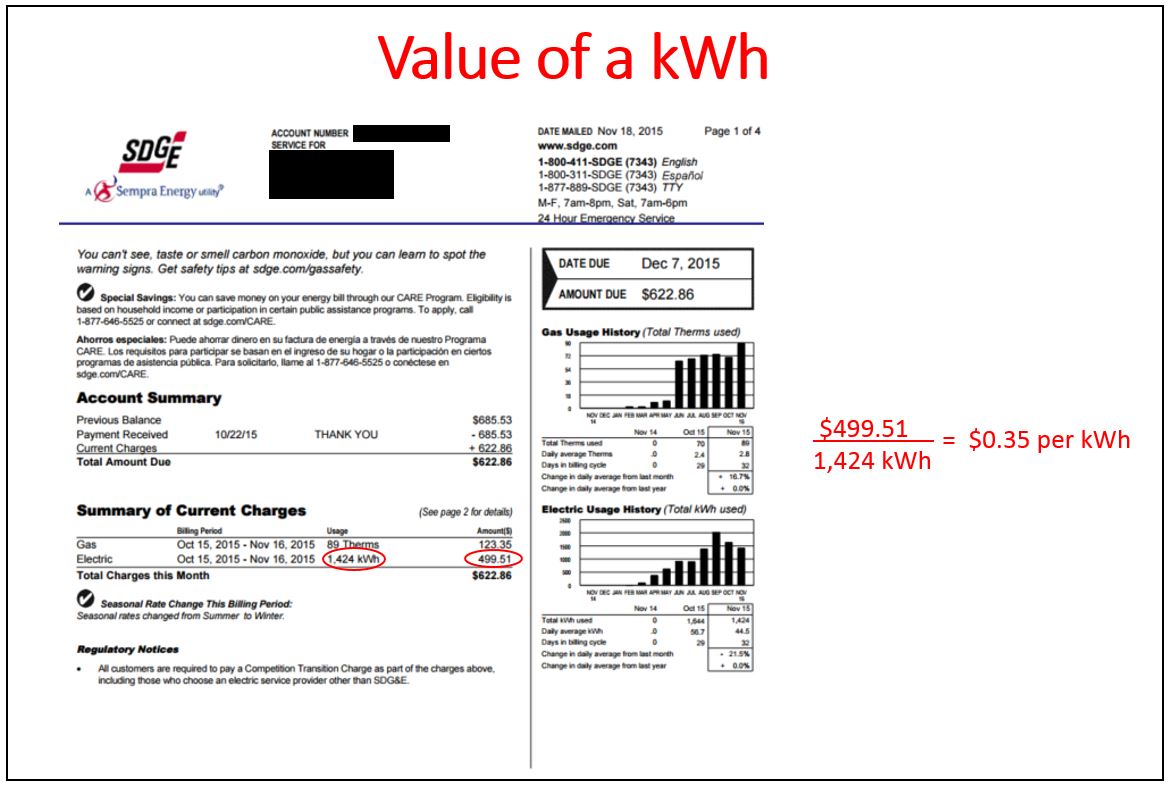
To get an exact understanding of what you are paying per kWh, you should look at your electric bill. Your bill will detail out your cost for each kWh. For example, in this bill you see that this San Diego Electric & Gas rate payer pays a total of $499.51 for a total consumption of 1,424 kWh. If you divide your total $ amount into the kWh consumption, you will get what you are paying per kWh. In this example, this homeowner is paying 35 cents per kWh. That is about 3 times higher than the US average.
Why is this homeowner paying so much per kWh than the average rate of electricity? Well, in this particular case, there are a few reasons. First of all, their location, being in California is one of the main reasons. California is one of the most expensive states when it comes to electricity pricing. Furthermore, this rate payer lives in SDG&E district. SDG&E’s base rate is 18 cents / kwH which is already higher than the CA average. Furthermore, SDGE has a tiered pricing scheme. As you can see in the below page of this rate payer bill, the cost of kWh goes higher as the rate payer uses more and more electricity. The base price of 18 cents per kWh jumps to 20 cents and then to 39 cents as the usage goes up. So the average for the bill ends up being 35 cents / kWh.
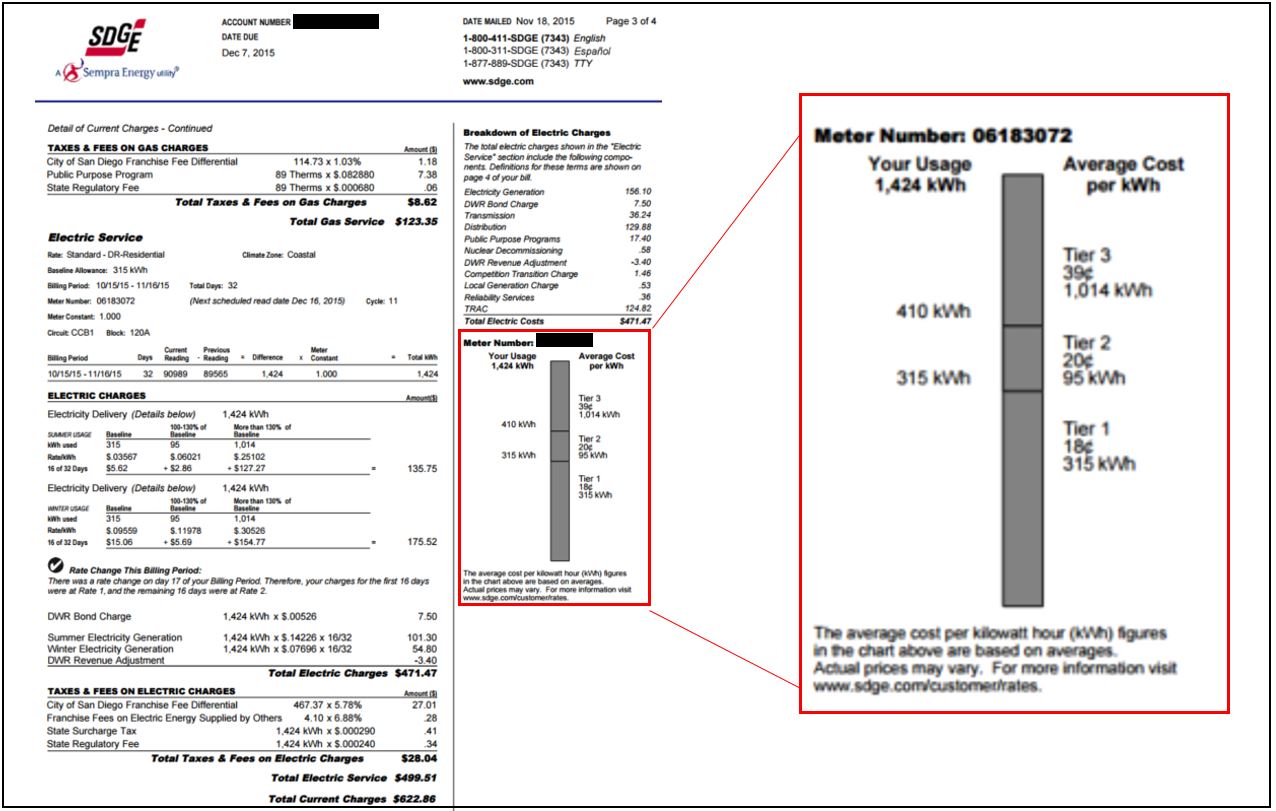
So in this homeowner’s case, she is paying 35 cents per kWh. As high as 39 cents per kWh for two thirds of her consumptions. So the value of a kWh for her is 39 cents for 1000 kWh and 18-20 cents for about 400 kWh of her usage.
Now let’s go back to our Return on Investment (ROI) math. The investment per Watt was 70 cents. And each Watt generates ~1.5 kWh of electricity per year. And let’s now assume the value of a kWh is not as high as 35 cents or 18 cents but let’s just assume it is about 14 cents which is the lowest base price for many utility districts across the nation. At 14 cents per kWh, that 70 cents of investment will yield about 1.5 x 14 cents (ie 21 cents) in value each year. That is 30% cash on cash return in its first year, and each year thereafter. And that return would in fact be more than 2 times higher (ie more than 60%) in the case of the above homeowner because the value of a kWh for her is above 30 cents (not the mere 14 cents we use in our math below).
Wow! That is an unheard of high return! Nobody makes such high returns on a capital investment. In fact, not even financial gurus like Warren Buffett achieve north of 25% return, let alone a 30 to 60 % return. This sounds too good to be true!
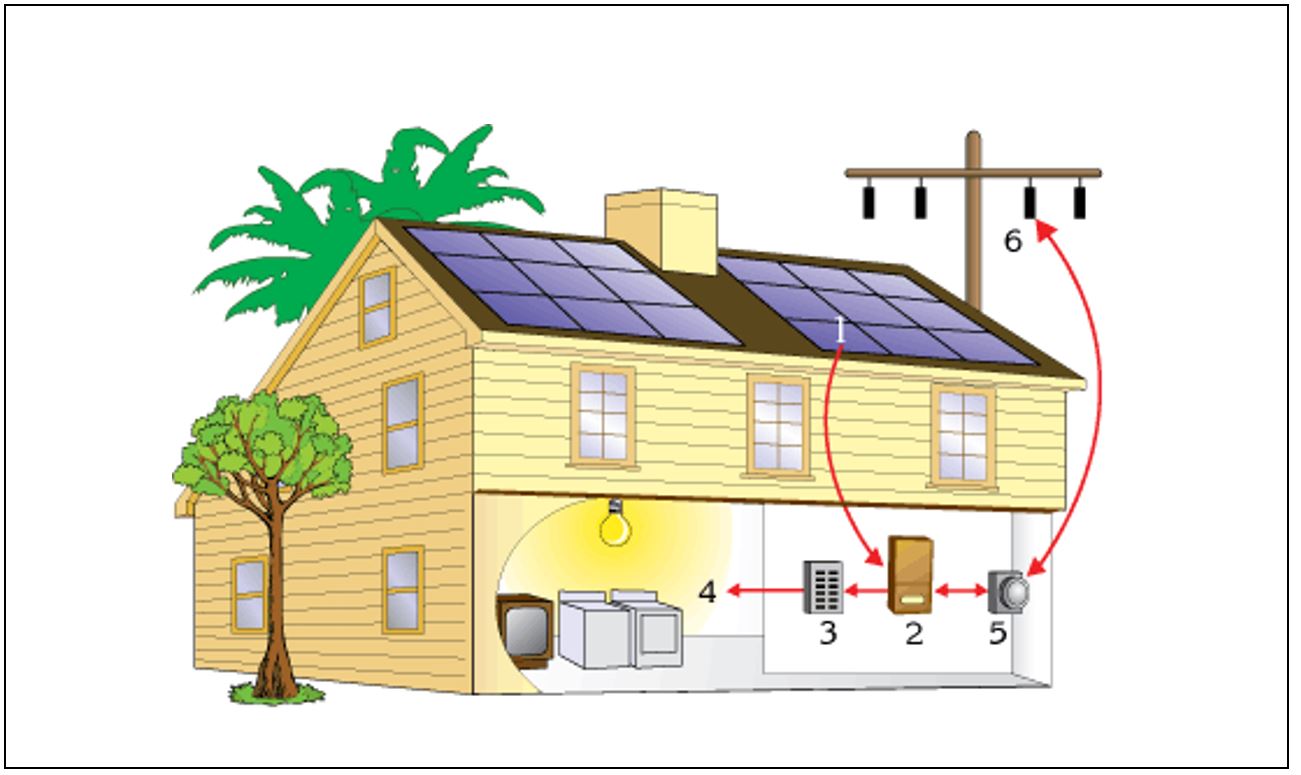
You must be thinking there must be a catch. And yes, there is a slight catch. And that is the fact that a complete solar installation does not only consists of solar panels. There are many other components like racking and mounting equipment, an inverter, other balance of system equipment like wires, connectors, switches, etc.
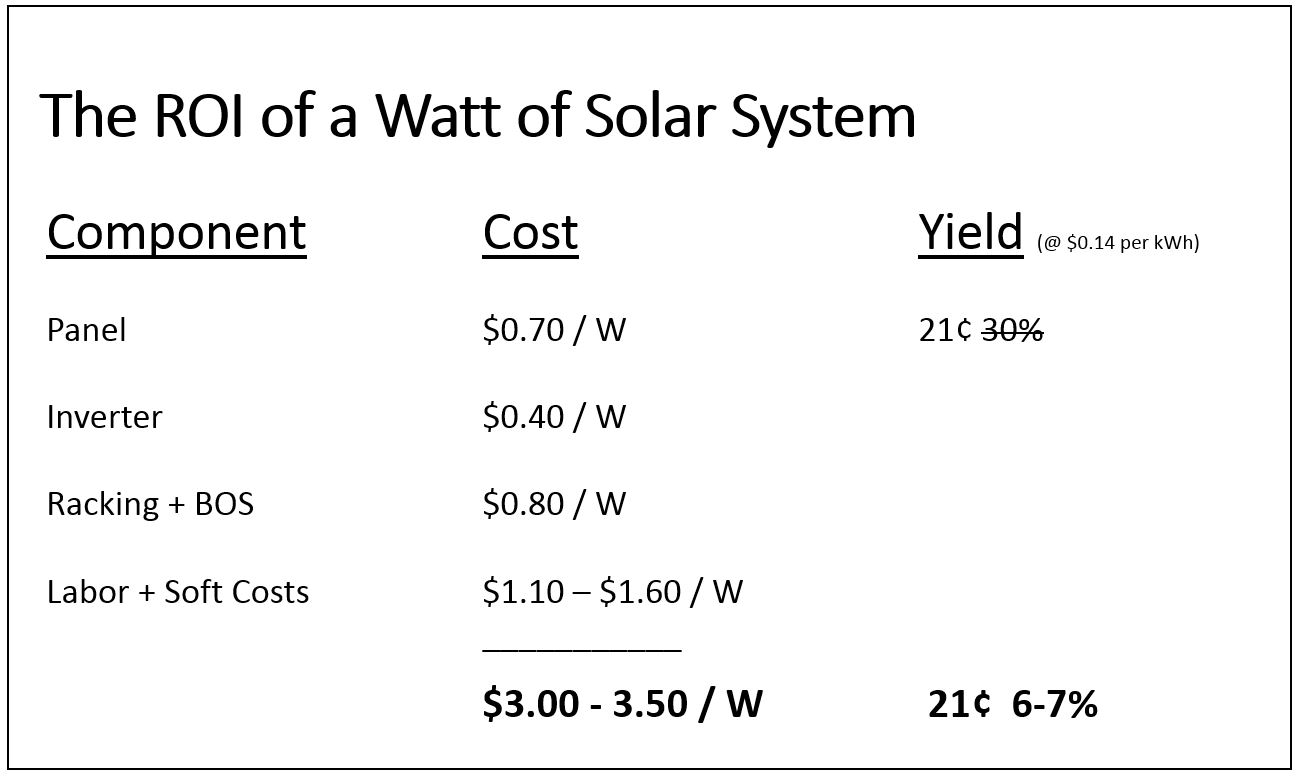
And most importantly there are many “soft costs” like the installer’s sales and marketing cost, the installation labor cost, the design and permitting costs that increase the price of an installation from $0.70 per Watt to about $3 – $3.50 per Watt. And when the system cost goes up by 4-5x, the yield of the investment goes down by 4-5x. So our 30% yield in the above case, becomes a 6-7% yield.
One good force that is still helping move the solar cause forward is the Federal 30% Investment Tax Credit incentive. This essentially allows property owners to get a rebate for 30% of the value of the final solar system price. So, in our above example, the homeowner would get a $0.90 rebate which would lower his investment from $3Â to $2.10, increasing the yield of the solar system to 10%.
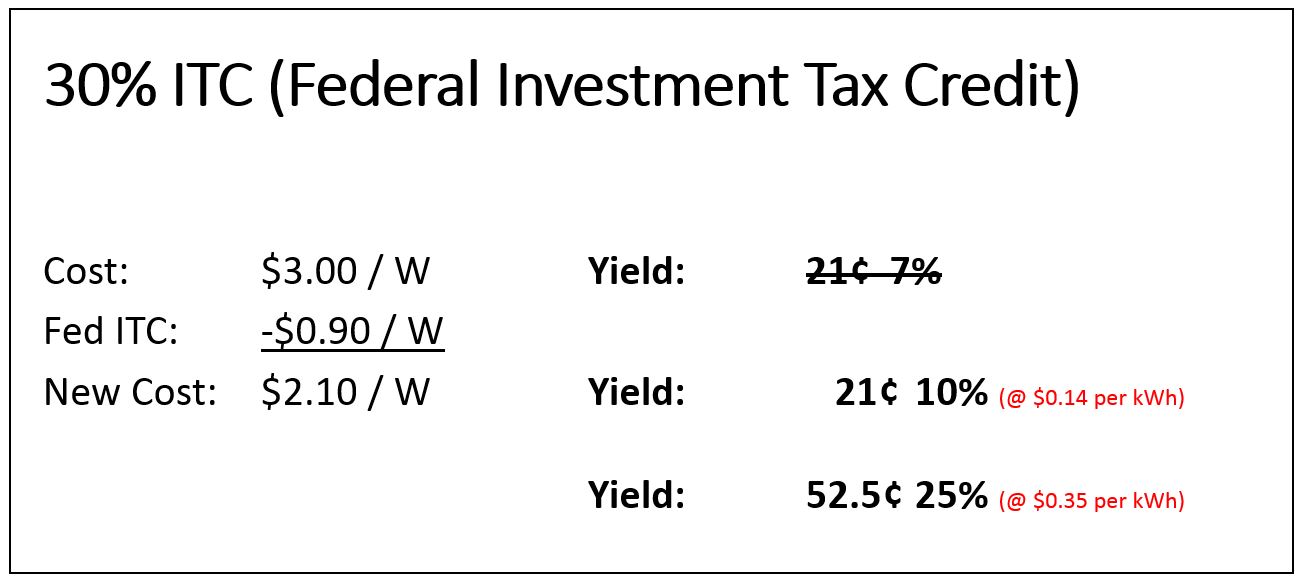
Of course a 10% yield means a 10 year pay back period. But keep in mind, that example was using the kWh price of 14 cents. If you are paying 35 cents per kWh like in the above San Diego Gas &Electric rate payer case, than your return would be a super high 25% return, implying a 4 year payback as opposed to a 10 year payback.