
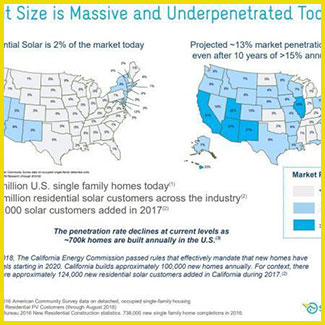
This graphic from Sunrun’s latest quarterly investor presentation (dated Dec 2018, slide 34) shows the current and 2027 expected solar rooftop penetration of each state.

This graphic from Sunrun’s latest quarterly investor presentation (dated Dec 2018, slide 34) shows the current and 2027 expected solar rooftop penetration of each state.