Tag: Solar Charts
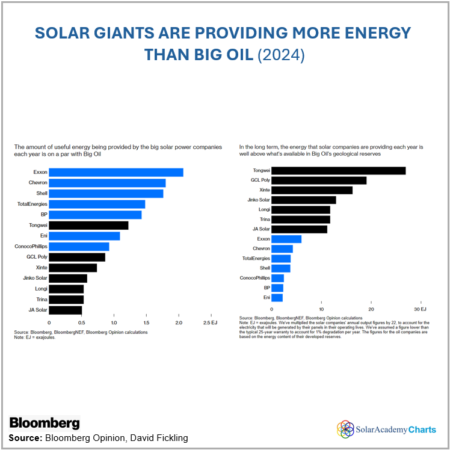
Solar Giants are Providing More Energy than Big Oil (2024)
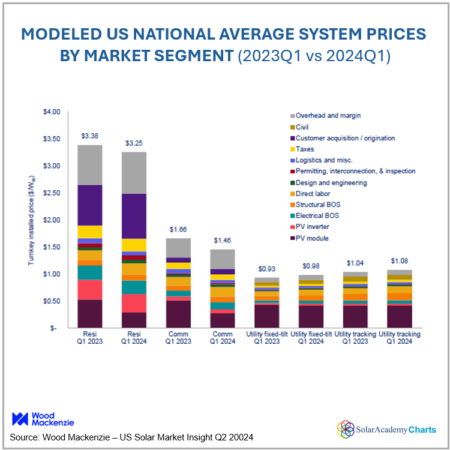
Modeled US national Average System Prices By Market Segment (2023Q1 vs 2024Q1)
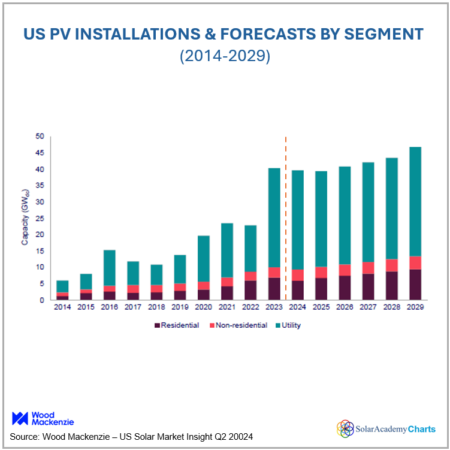
US PV Installations & Forecasts by Segment (2014-2029)
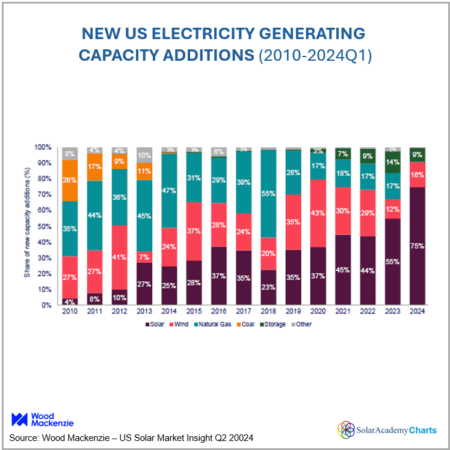
New US Electricity Generating Capacity Additions (2010-2024Q1)
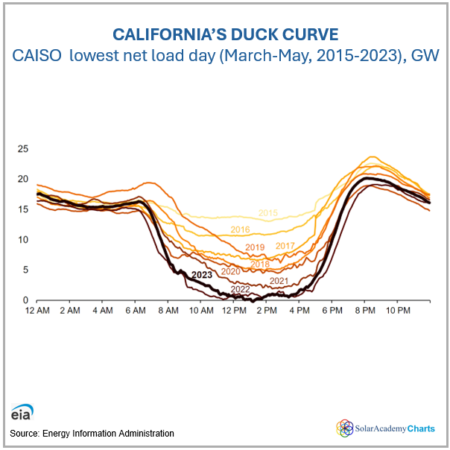
California’s Duck Curve (2015-2023)
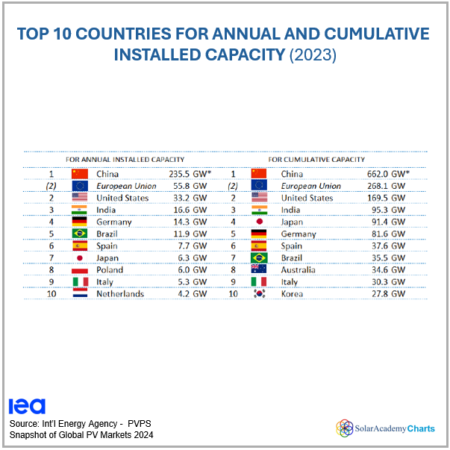
Top 10 Countries for Annual and Cumulative Installed Solar PV Capacity (2023)
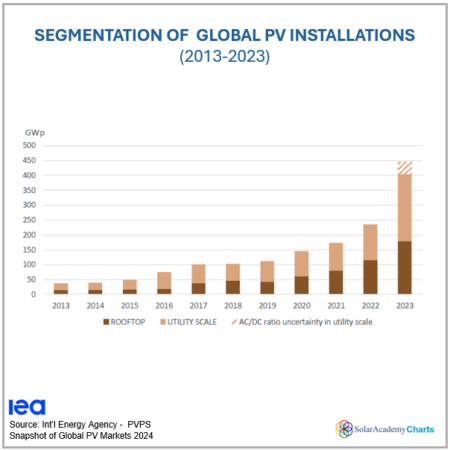
Segmentation of Global PV Installations (2013-2023)
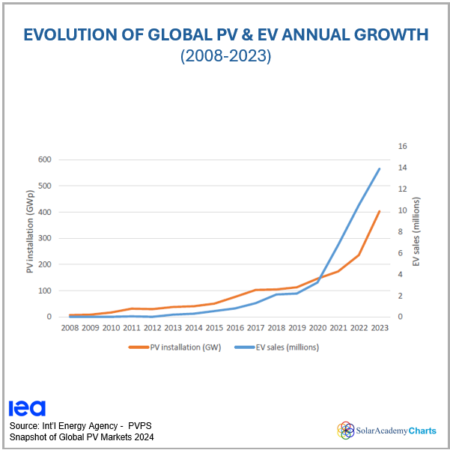
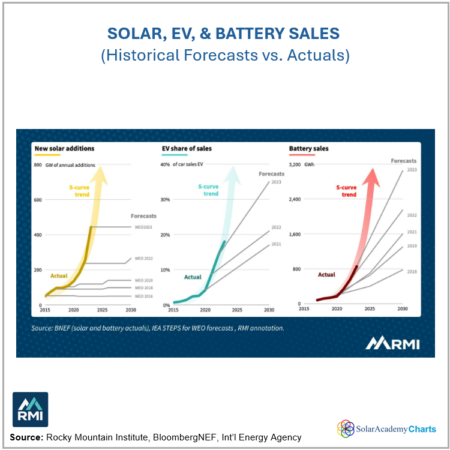
Evolution of Global PV & EV Annual Growth (2008-2023)
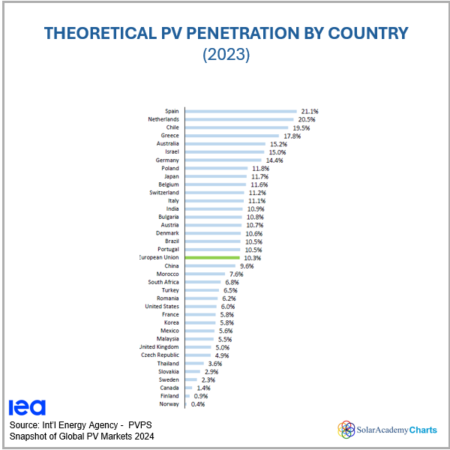
Theoretical PV Penetration by Country (2023)
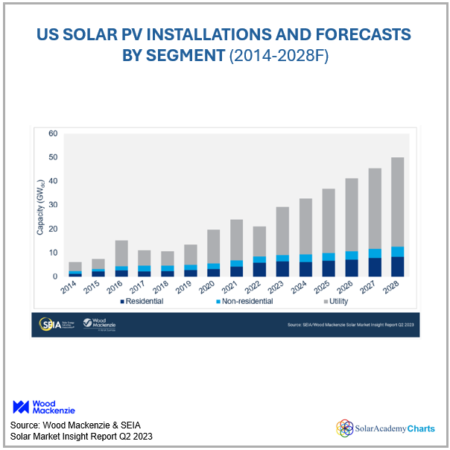
US Solar PV Installations and Forecasts by Segment (2014-2028F)
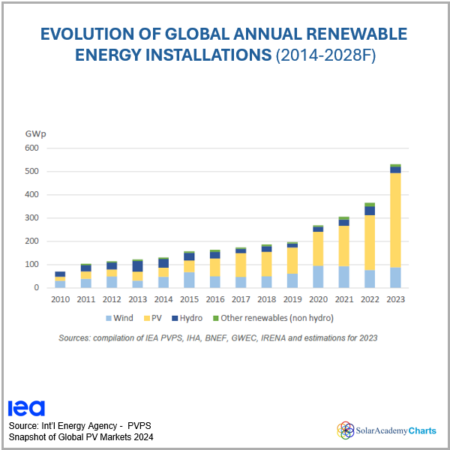
Evolution of Global Annual Renewable Energy Installations (2014-2028F)
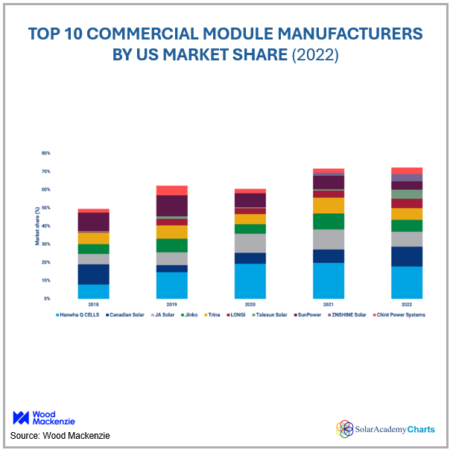
Top 10 Commercial Module Manufacturers by US Market Share (2022)
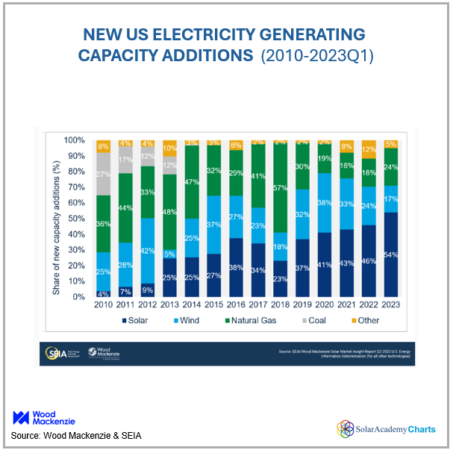
New US Electricity Generating Capacity Additions (2010-2023Q1)
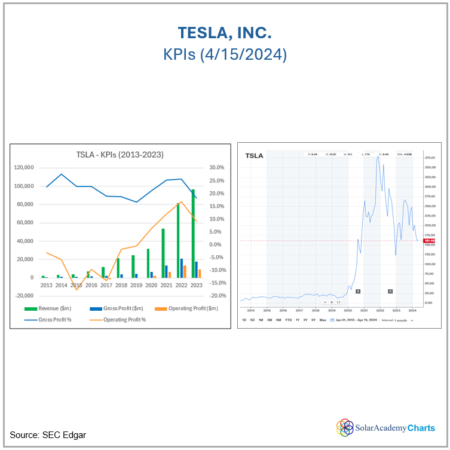
Tesla, Inc. KPIs (2013-2023)
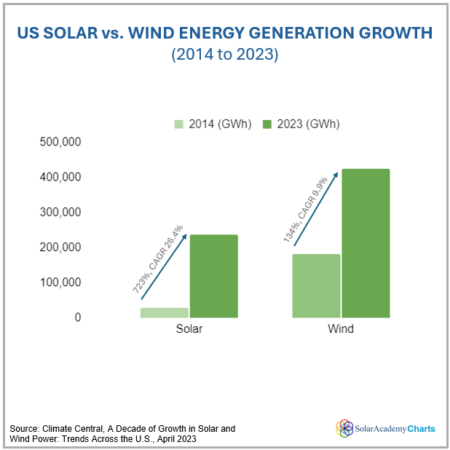
US Solar vs. Wind Energy Generation Growth (2014-2023)
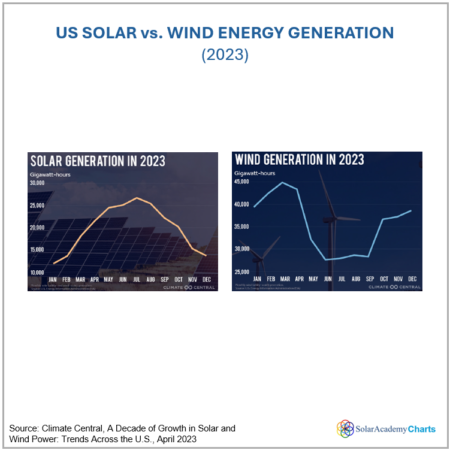
US Solar vs. Wind Energy Generation (2023)
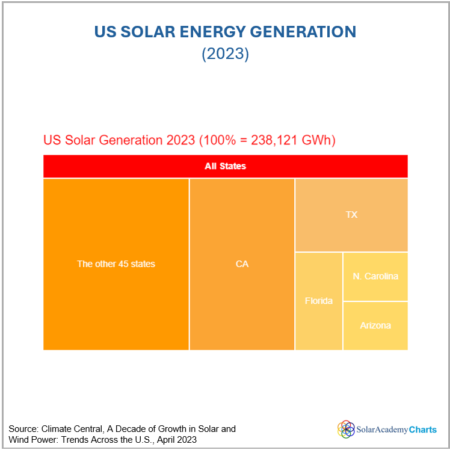
US Solar Energy Generation (2023)
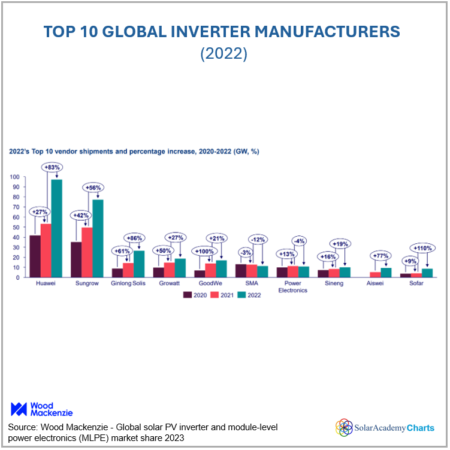
Top 10 Global Inverter Manufacturers (2022)
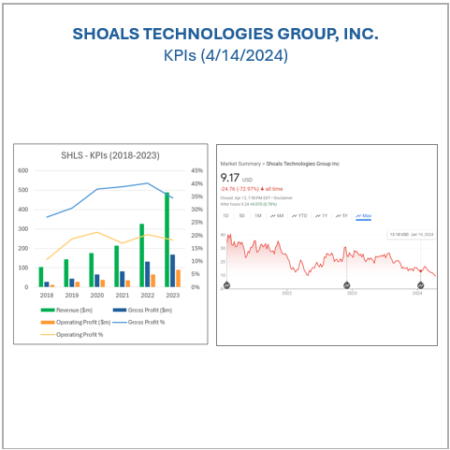
Shoals Technologies Group, Inc. KPIs (4/14/2021)
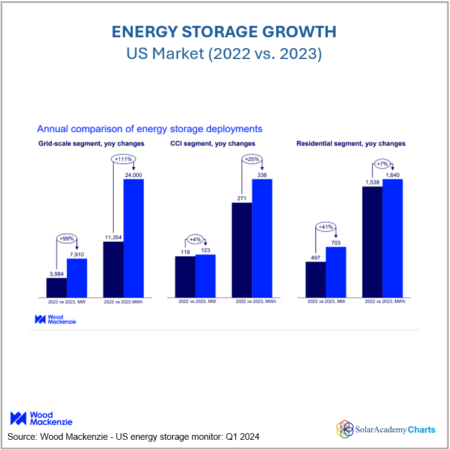
Energy Storage Growth – US Market (2022 vs. 2023)
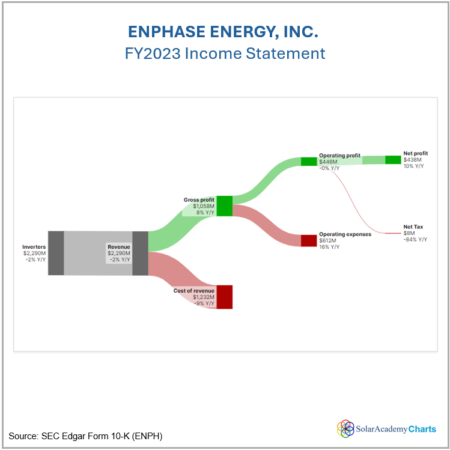
Enphase Energy, Inc. – FY2023 Income Statement
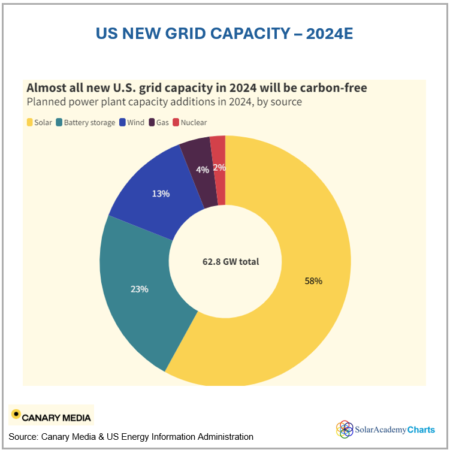
US New Grid Capacity (2024E)
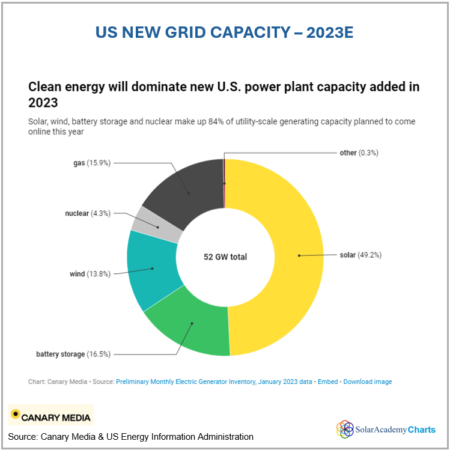
US New Grid Capacity (2023E)
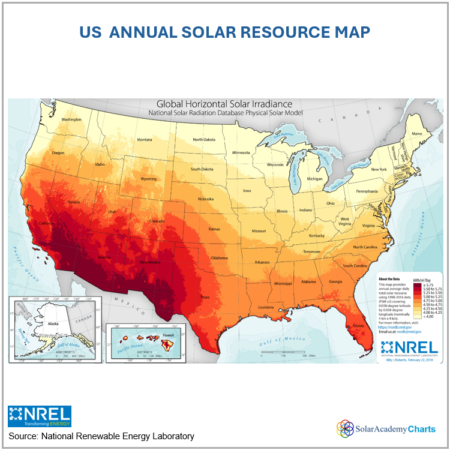
US Annual Solar Resource Map
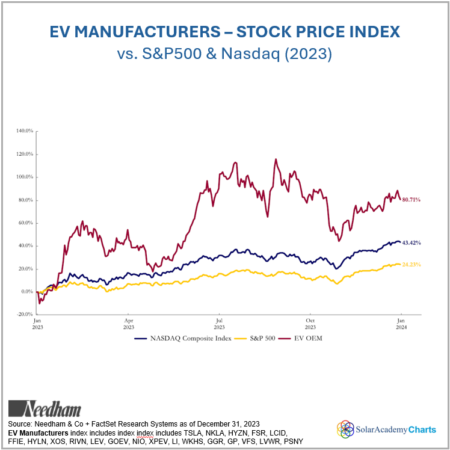
EV Manufacturers – Stock Price Index (2023)
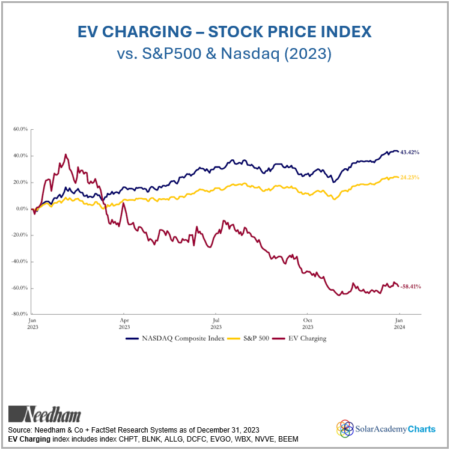
EV Charging – Stock Price Index (2023)
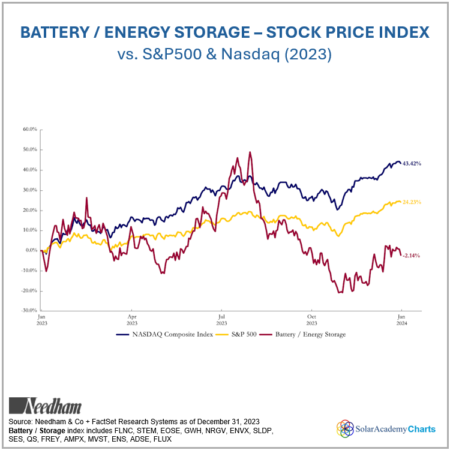
Battery / Energy Storage – Stock Price Index (2023)
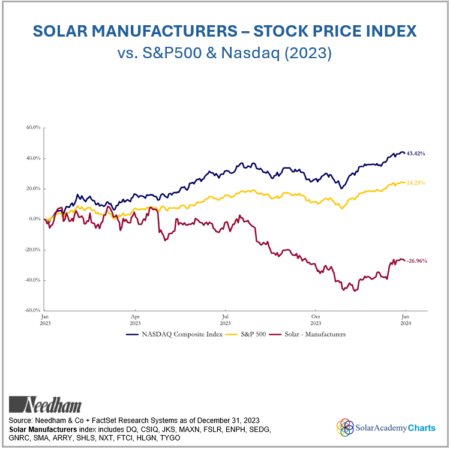
Solar Manufacturers – Stock Price Index (2023)
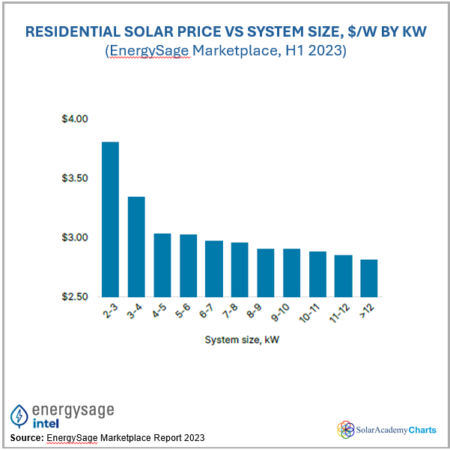
Residential Solar Price vs System Size, $/W by kW
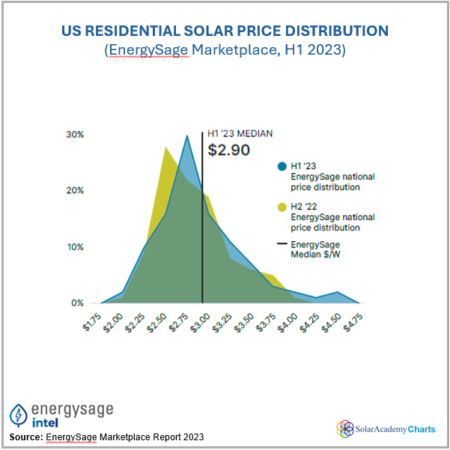
US Residential Solar Price Distribution (H1 2023)
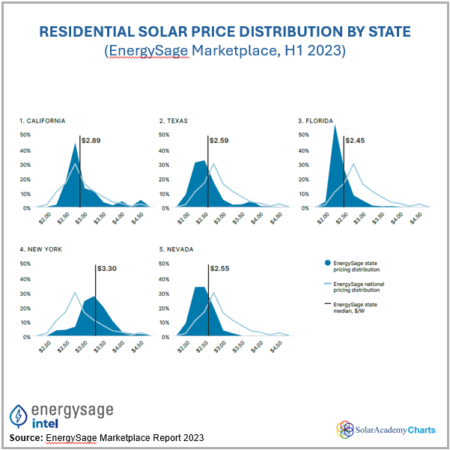
Residential Solar Price Distribution by State (H1 2023)
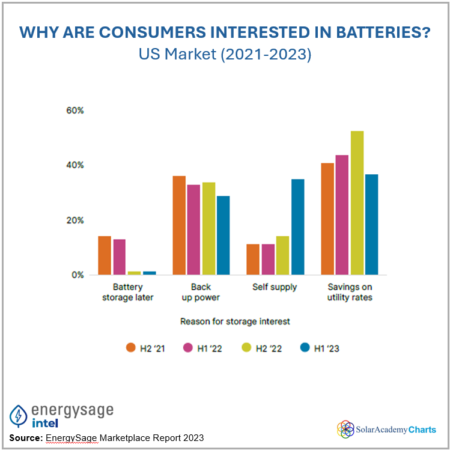
Why are US Consumers Interested in Batteries?
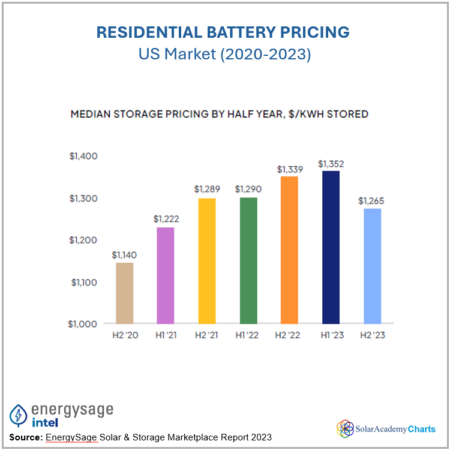
Residential Battery Pricing – US Market (2020-2023)
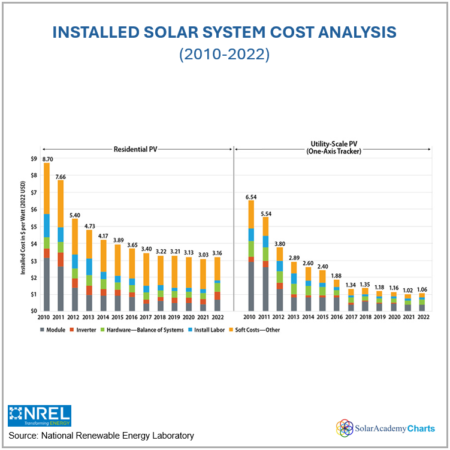
Installed Solar System Cost Analysis – US Market (2010-2022)
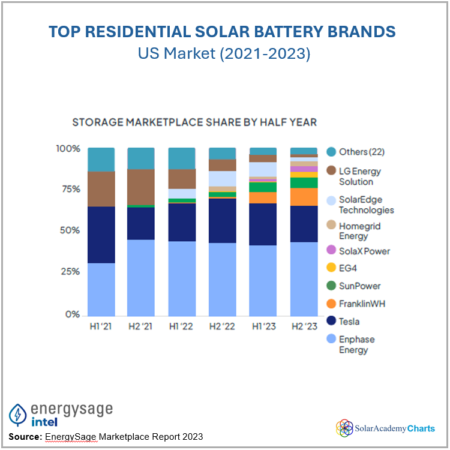
Top Residential Solar Battery Brands – US Market (2021-2023)
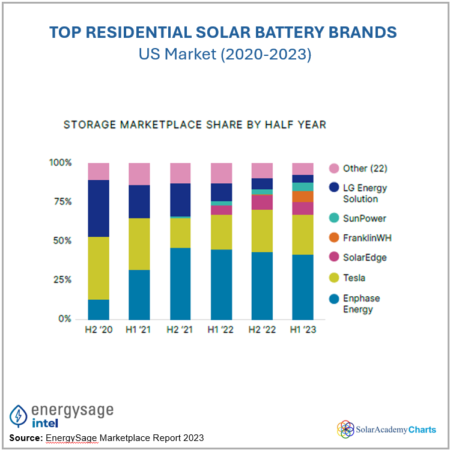
Top Residential Solar Battery Brands – US Market (2020-2023)
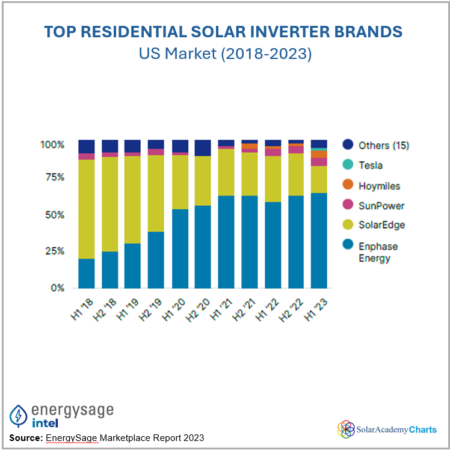
Top Residential Solar Inverter Brands – US Market (2018-2023)
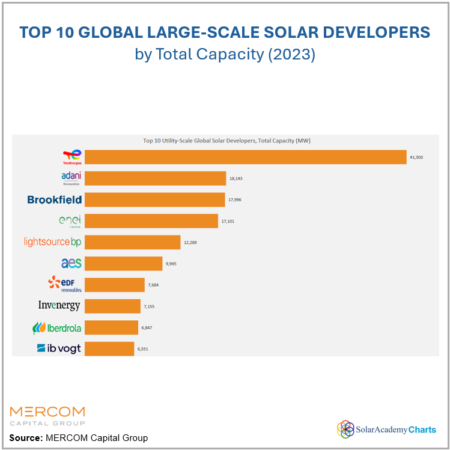
Top 10 Global Large-Scale Solar Developers (2023)
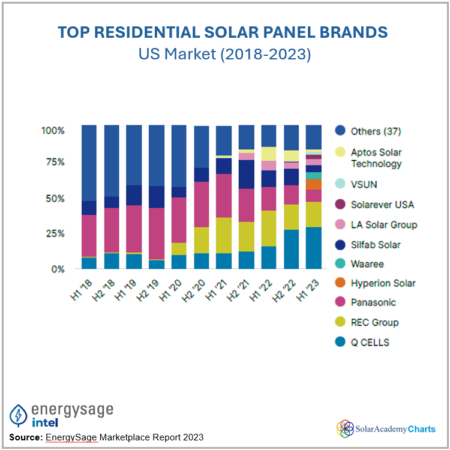
Top Residential Solar Panel Brands – US Market (2018-2023)
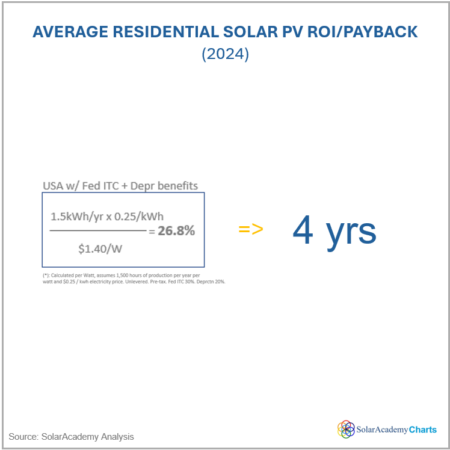
Average Residential Solar PV ROI/Payback (2024)
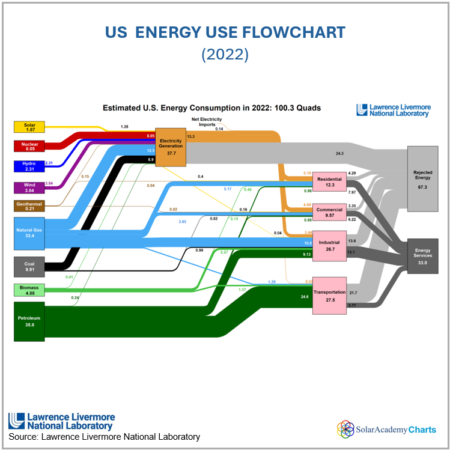
US Energy Use Flowchart (2022)
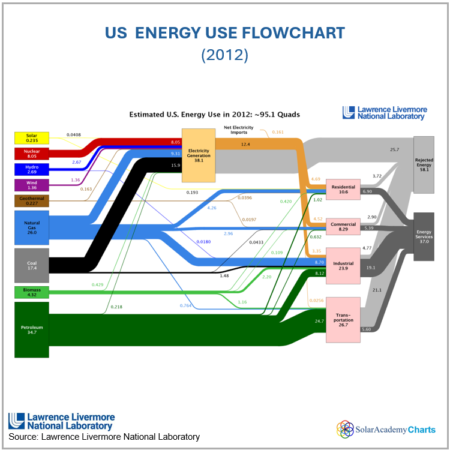
US Energy Use Flowchart (2012)
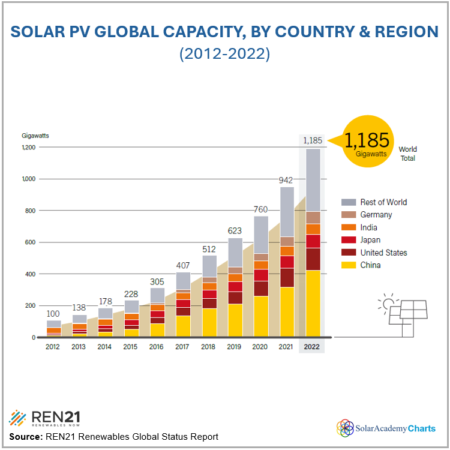
Solar PV Global Capacity, By Country & Region (2012-2022)
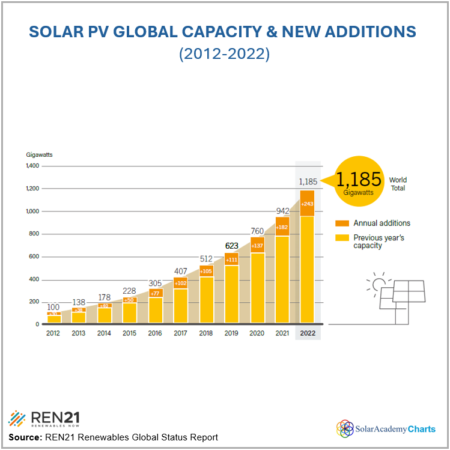
Solar PV Global Capacity & New Additions (2012-2022)
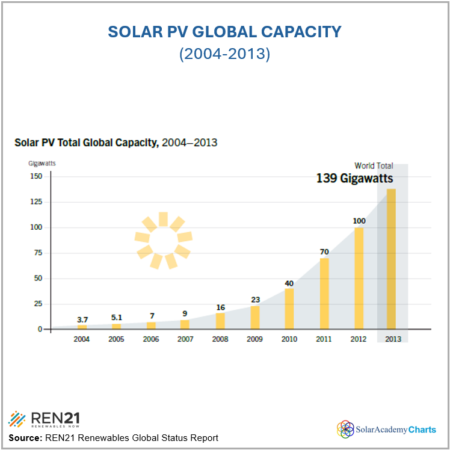
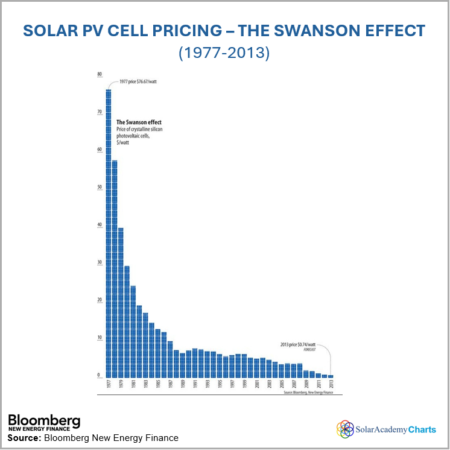
Solar PV Global Capacity (2004-2013)